GlobalWebIndex does a great Chart of the Day service which gives you an infographic everyday.
One of their recent ones was a survey on what Internet users would rather have:
- Television
- Their car
- Watching TV
- Their phone
- A cup of coffee
How do you think TV vs Facebook turned out?
The results are interesting:
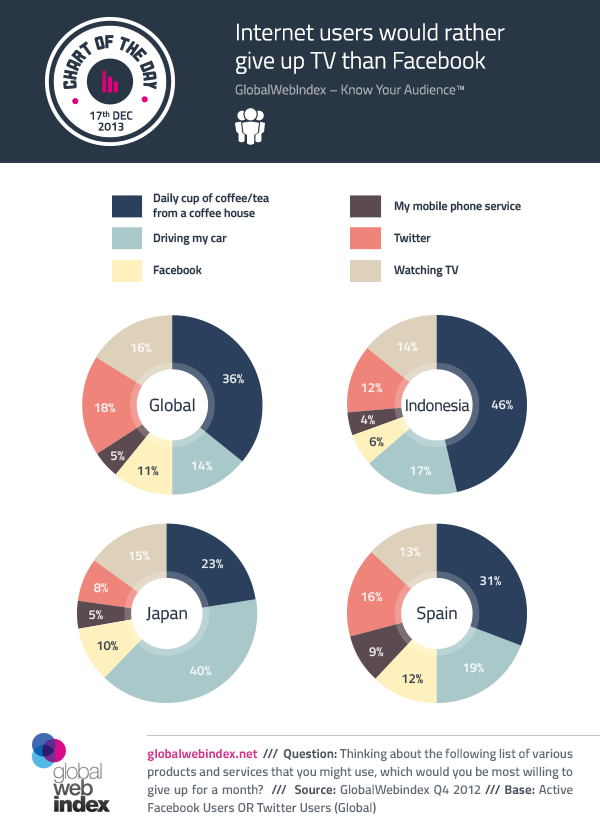
Here are my three favorite stats:
- The least desired globally was a cup of coffee, though Japan was an outlier focusing on their car more.
- The highest stat in all of these was having their phone. Apparently our phone is very needed.
- In every stat, people would rather have their social media account, Twitter or Facebook, rather than having television.
It would be interesting to see how your responses are similar or different.
Let us know in the comments: What would you be willing to give up?
Jeremy Smith
Jeremy is owner of ChurchAndMentalHealth.com and the Co-Occurring Program Coordinator and a Licensed Professional Clinical Counselor at a community mental health center. Jeremy has a history of working as a ministry director for Youth for Christ for 8 years and then working as a mental health and substance use adult counselor in Colorado and Ohio, specifically running an Opioid Residential Treatment Center.


Speak your mind...