
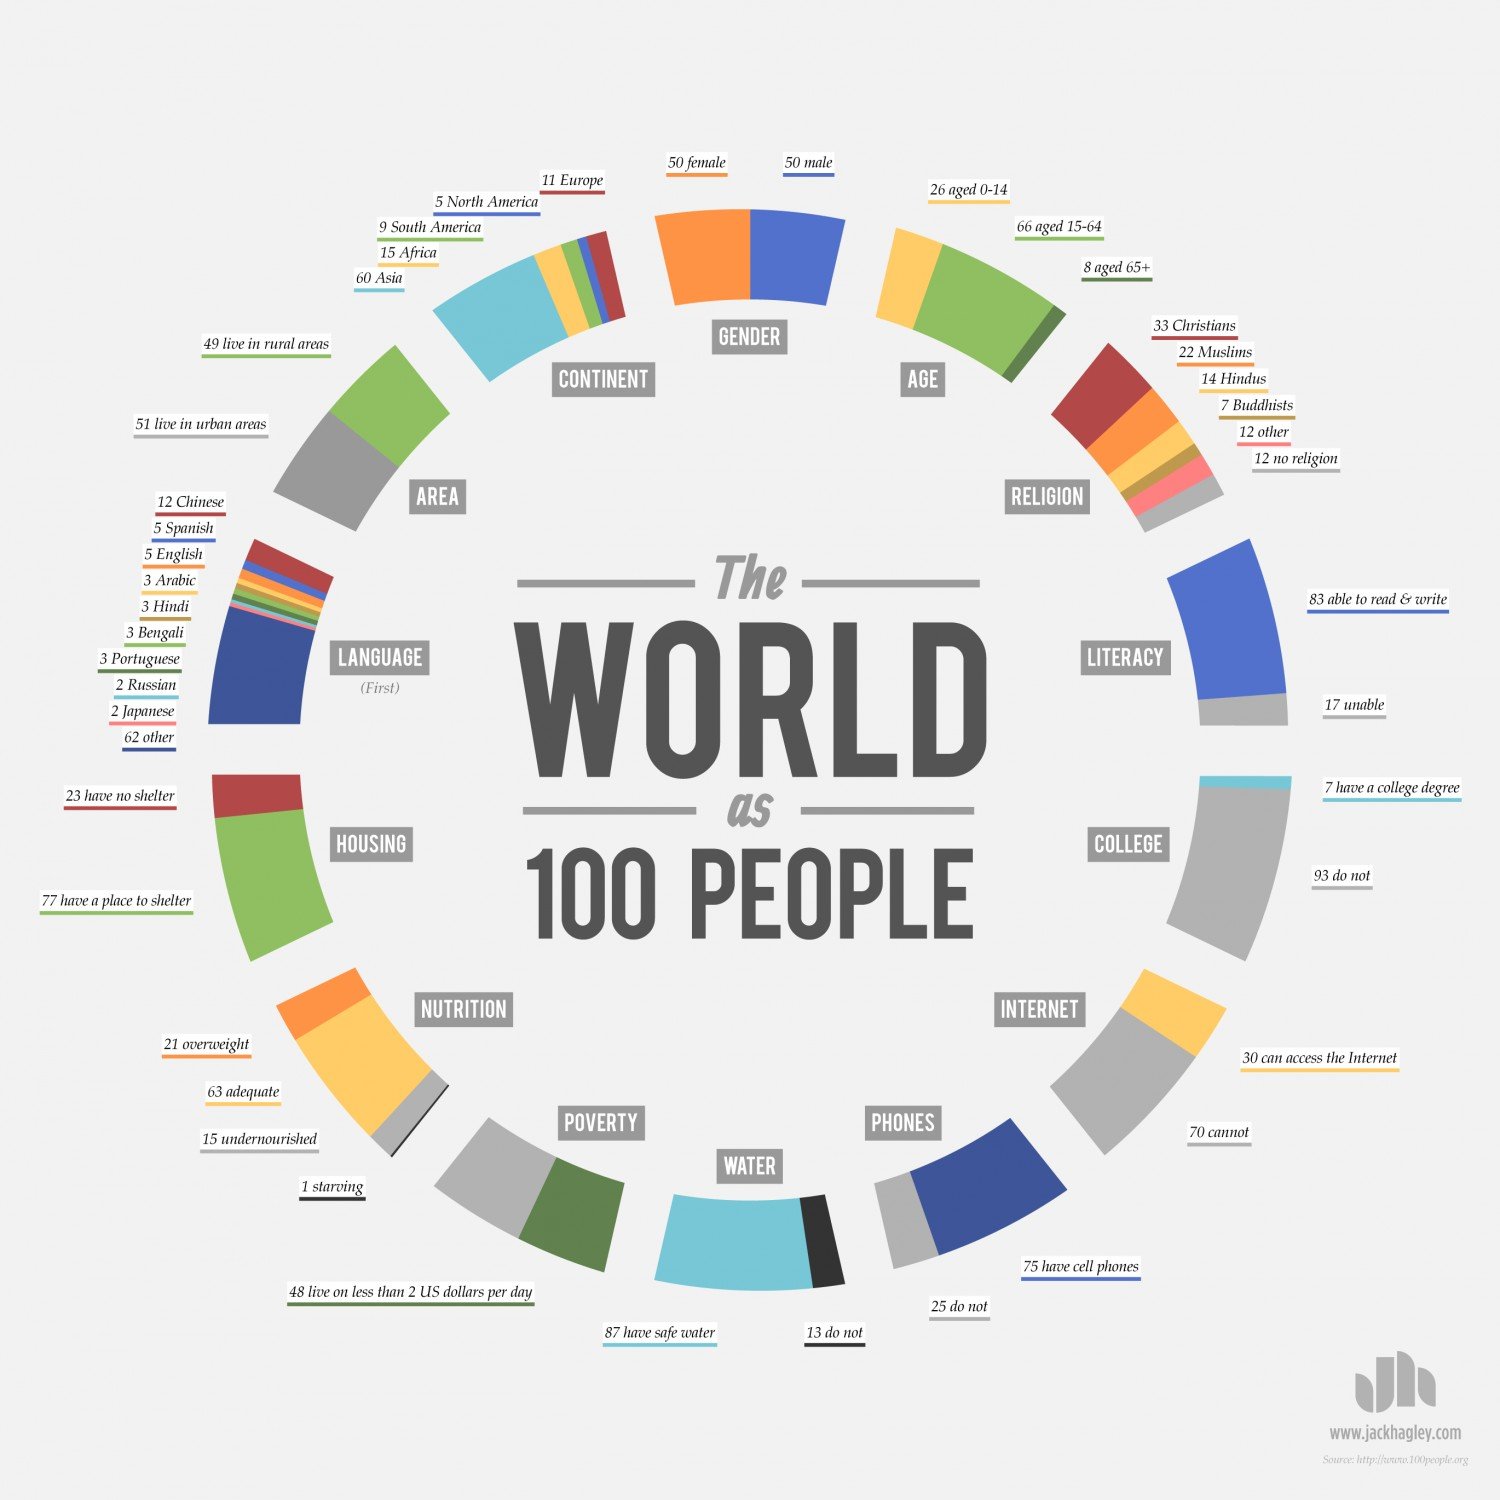
Jack Hagley took the statistics from 100people.org and has created a wonderfully visual design of what our world would look like if it was put into a 100 person sample.
Honestly, the research is old (1990 and 1992) so note that there are variations and errors in the infographic, but it truly does take you to an existential place where your world is put into perspective. The point is still made, if you are viewing this on an Internet, on your own computer, and in your own house or at your own job, you are blessed.
[Click for Larger]
What are your thoughts on this?
[Image via woodleywonderworks via Compfight cc]
Jeremy Smith
Jeremy is owner of ChurchAndMentalHealth.com and the Co-Occurring Program Coordinator and a Licensed Professional Clinical Counselor at a community mental health center. Jeremy has a history of working as a ministry director for Youth for Christ for 8 years and then working as a mental health and substance use adult counselor in Colorado and Ohio, specifically running an Opioid Residential Treatment Center.


I think breaking statistics down to a more understandable level is far more powerful than saying “um-teen billion.”
Is that the secret sauce to infographics?
Maybe. Just maybe.