Visually displaying data can be the best way to convey a message and make your point. That’s why infographics are so great!
But what if the data wasn’t locked in? What if the data was visually displayed using some sweet JavaScript?
Yeah. Now we’re talkin’!
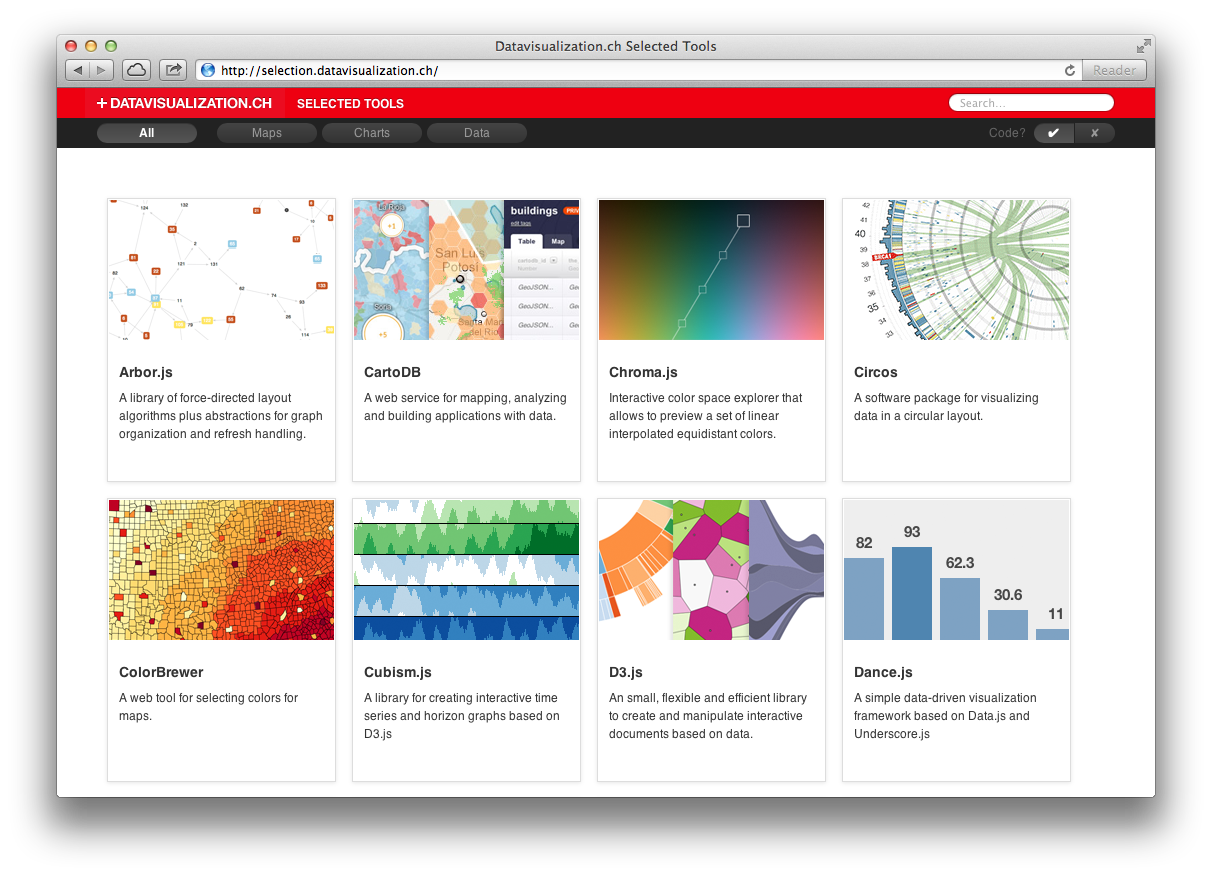
Here’s an excellent directory of such tools:
DATAVISUALIZATION.CH Tools
Each of these tools includes a short description and set of links to learn more and download the source files. A great resource!
Take a look at all the different ways to dynamically display data on the DATAVISUALIZATION.CH website.
Eric Dye
Support Lead at Valet, and Proprietor of DYECASTING. Human by day, gamer at night, lover of coffee, and all things spicy.


The timing of this couldn’t be more perfect!
Been looking for this kind of stuff for two days!
Ta-da! 😀
It took me forever to find some of this stuff when I had the need for it. This is an excellent collection of dataviz tools. It covers the spectrum from code-intensive to extremely simple/elegant. All are top-notch, too.
Seriously. A great collection, indeed! #bookmarked