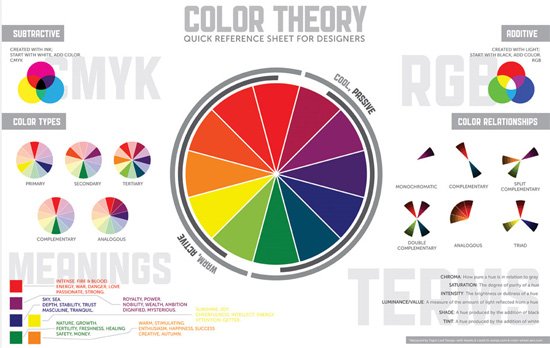
If you did not know, I love infographics. Taking the statistics from a subject, engineering a few graphs, adding a little flair, and you get your own infographic. The idea that other people learn from a visual presentation means that infographics are simply redisplaying the content so that more people process it better.
Now, you may have wondered how people make their infographics. Yes, most of them are done in some expensive image editing software and with a company that has a designer with their $120,000 art degree. But, if you are on a cheaper budget than that, we have some alternatives for you.
Visual.ly
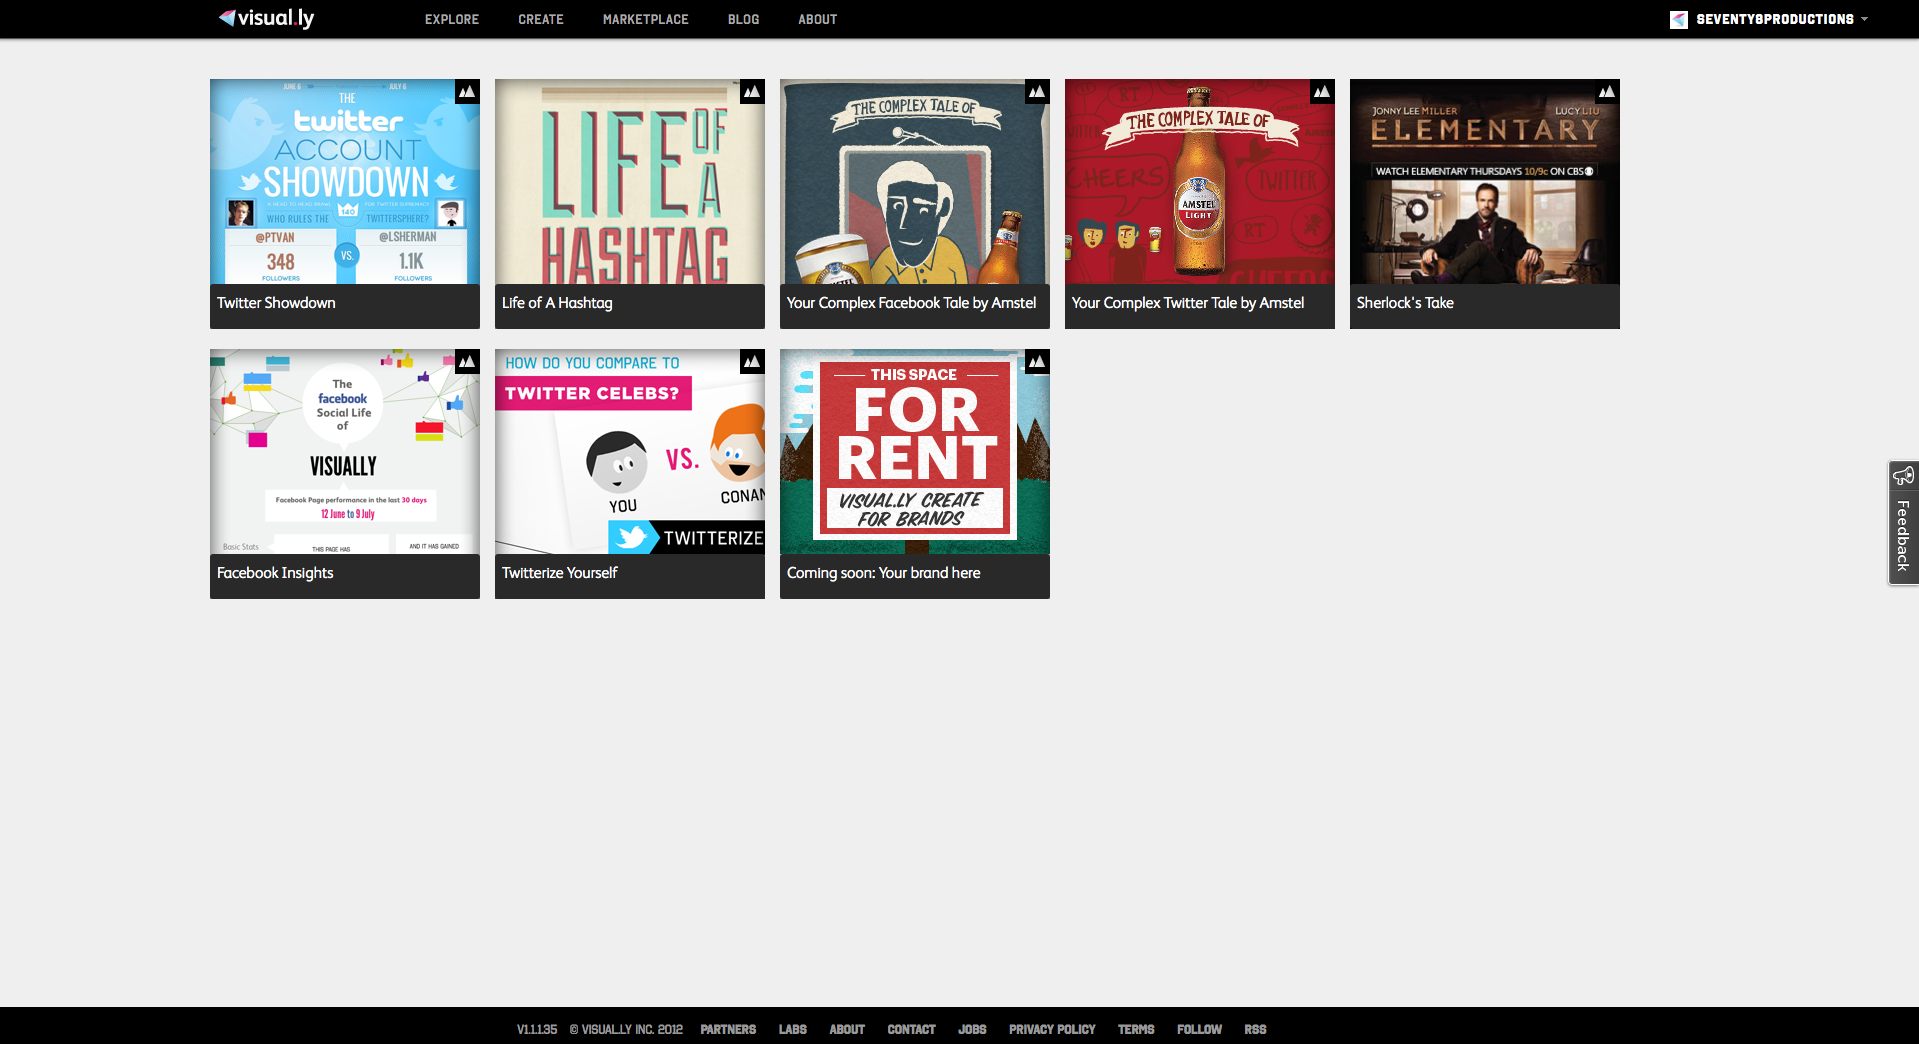
Visual.ly offers a few social media infographic designs to create great content from your social media statistics. Of course, this may be a bit limiting, so they do have a marketplace that can offer fairly reasonable costs for your business.
Easel.ly
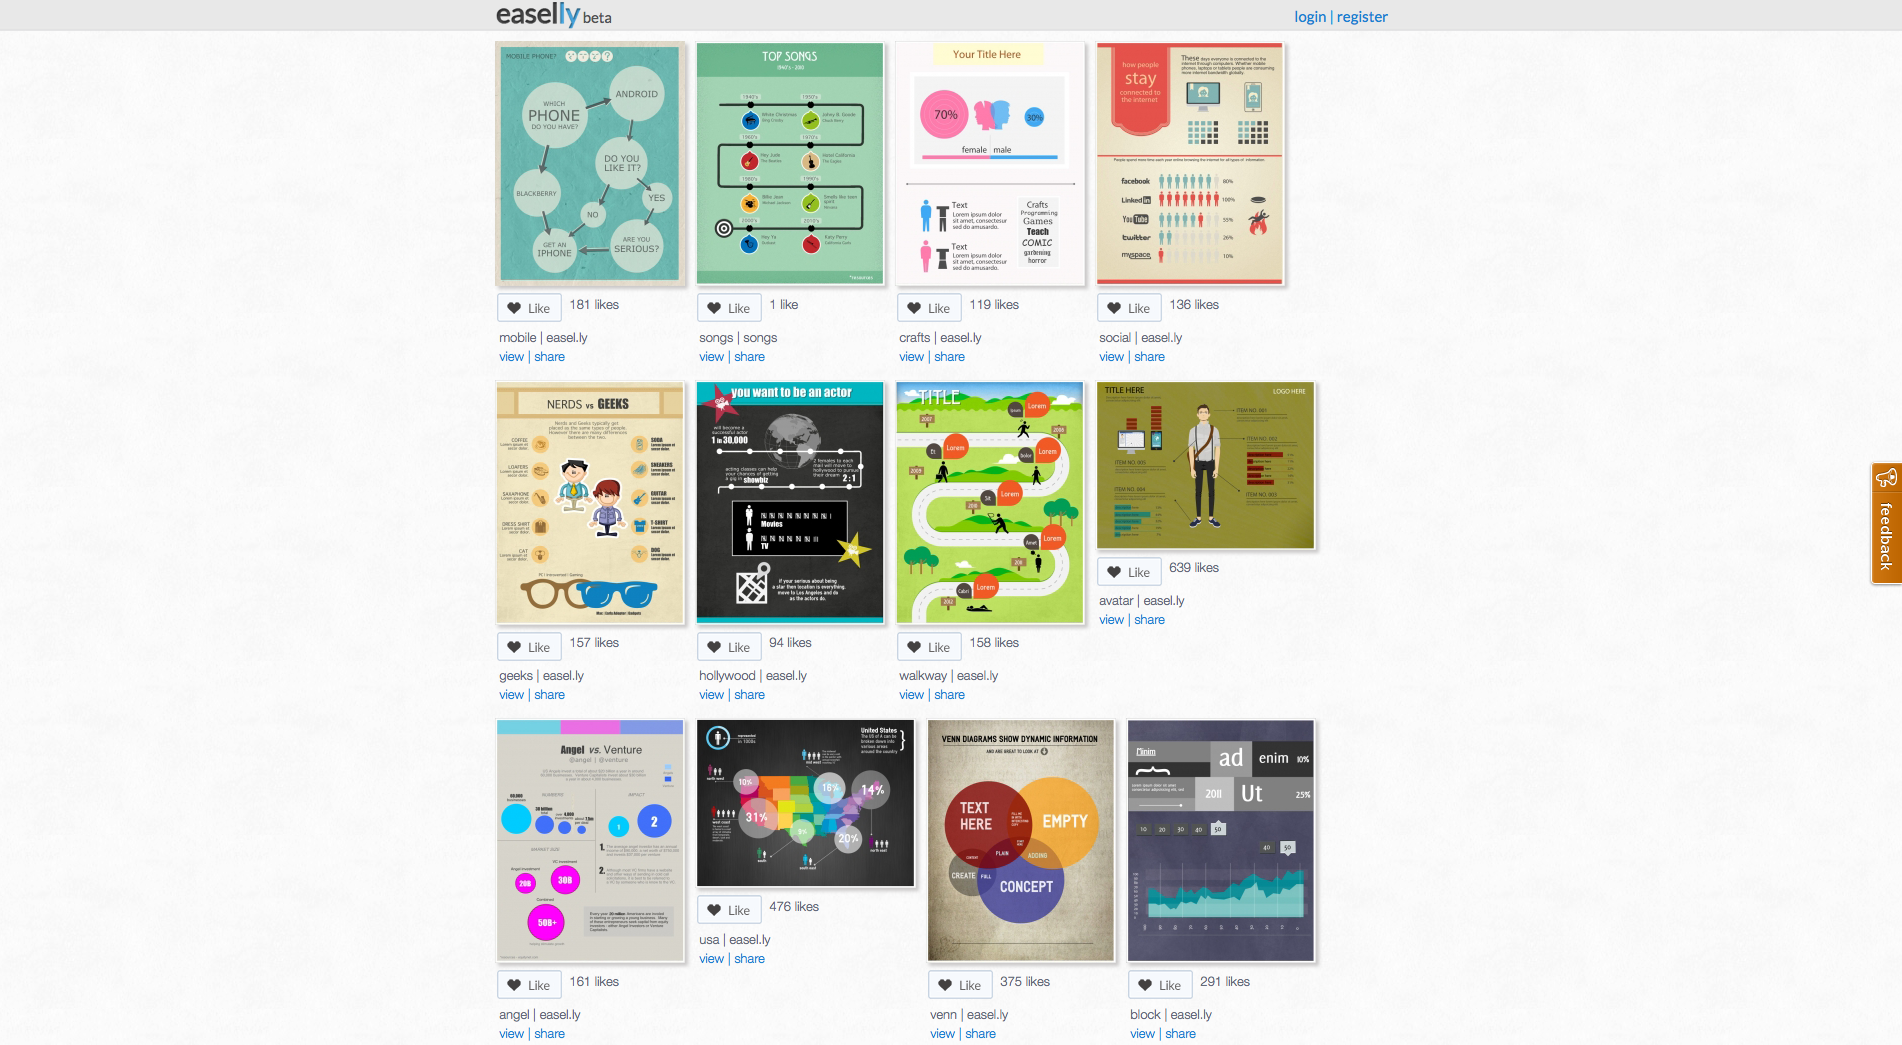
Easel.ly is a much more manual infographic constructing site which means you can create whatever kind of data in the infographic, but it needs to be entered manually.
infogr.am
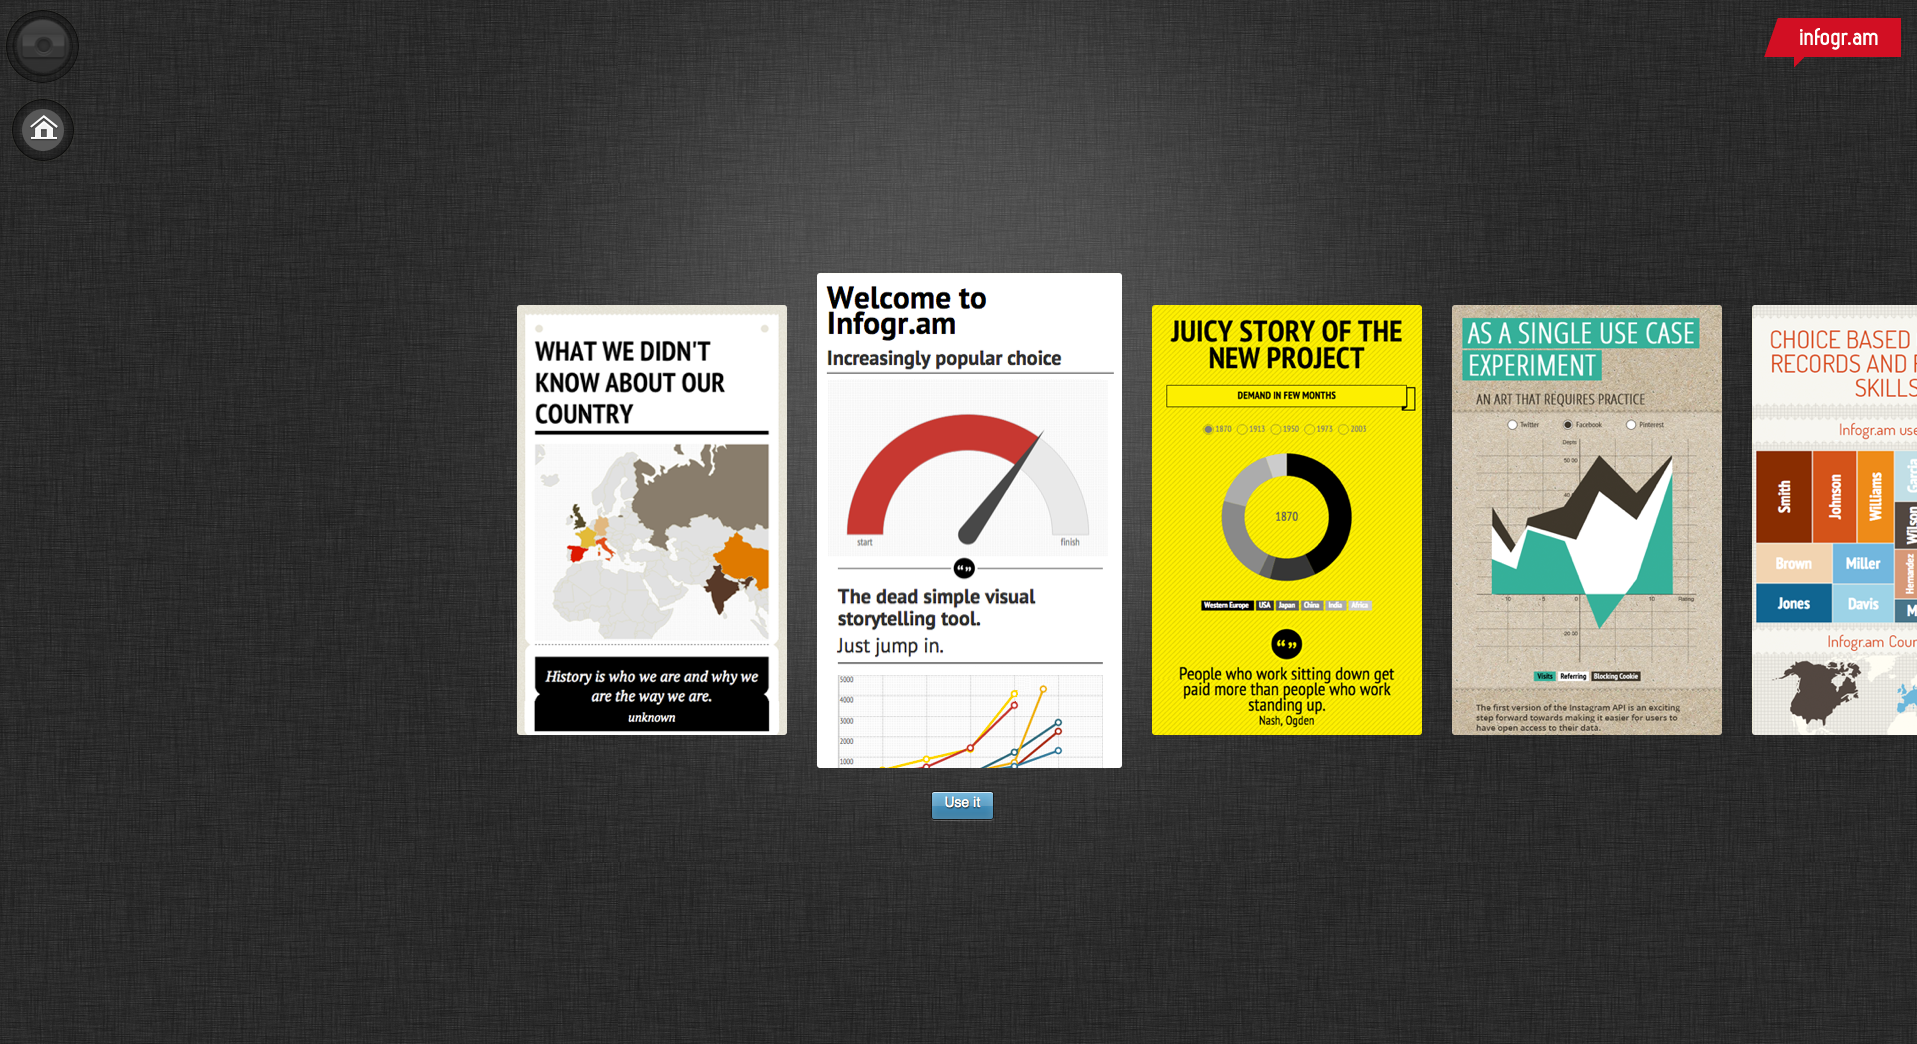
Infogr.am is that nice in between infographic designer. You are a bit limited in how you design your infographic, but it is data based and so you need little to no design skills.
If you make an infographic, share the image’s URL in the comments below!
Jeremy Smith
Jeremy is owner of ChurchAndMentalHealth.com and the Co-Occurring Program Coordinator and a Licensed Professional Clinical Counselor at a community mental health center. Jeremy has a history of working as a ministry director for Youth for Christ for 8 years and then working as a mental health and substance use adult counselor in Colorado and Ohio, specifically running an Opioid Residential Treatment Center.


Speak your mind...